Description
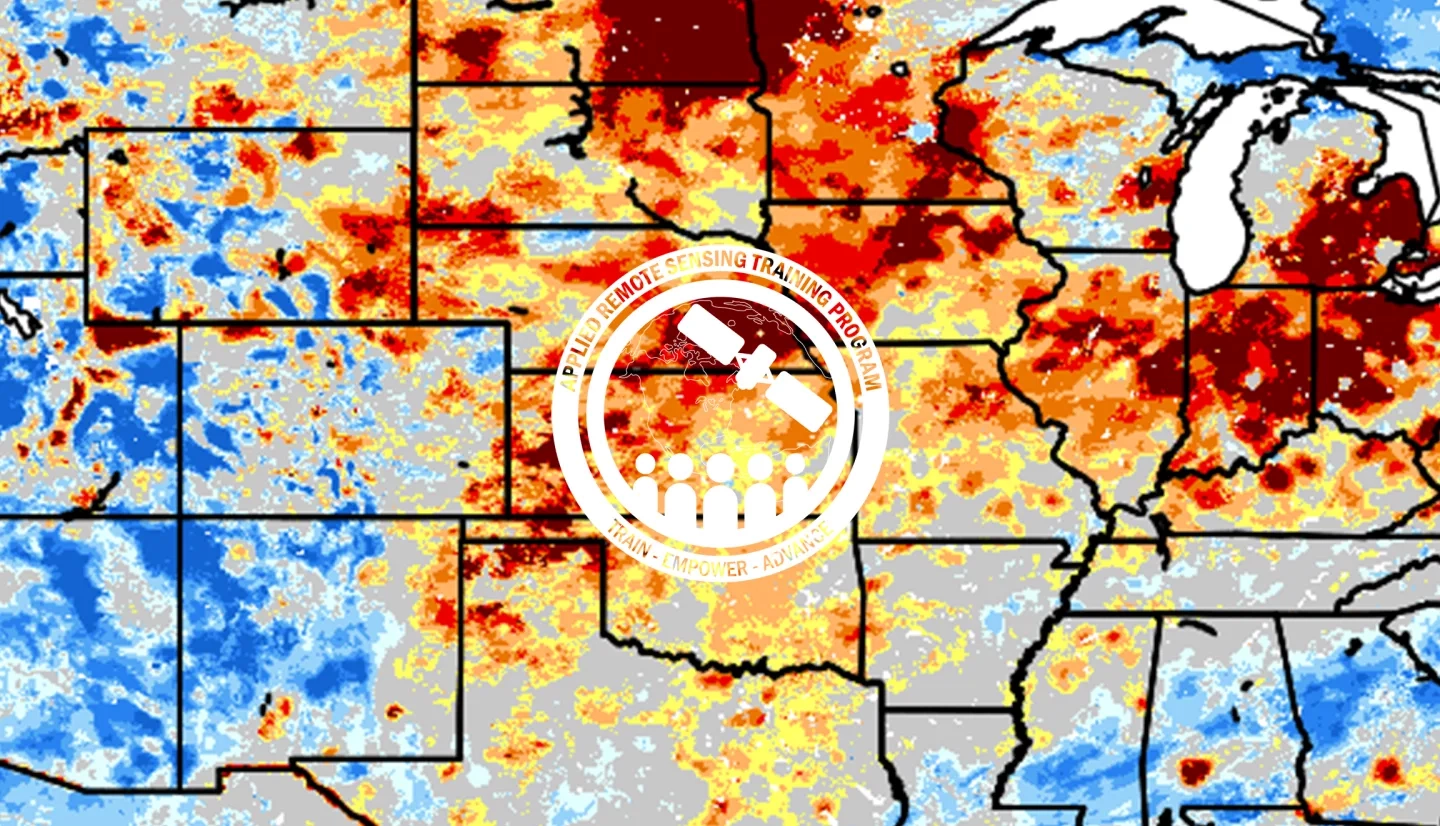
This training is focused on the introduction of the NASA Land Information System (LIS) output of soil moisture at various depths for drought analysis and monitoring. Traditional drought applications and indices focus on sensible weather (temperature, wind, etc.) and precipitation trends and their impacts on the hydrologic system. As a result of the NASA Short-term Prediction Research and Transition Center (SPoRT) program and its research-to-operations (R2O) work, this training will demonstrate how LIS output of soil moisture from a land surface model (LSM) can be included in traditional drought monitoring applications. The NASA SPoRT Program has implemented a version of NASA LIS (SPoRT-LIS) that utilizes near real-time Green Vegetation Fraction (GVF) from S-NPP/VIIRS retrievals, as opposed to static, climatology values of GVF.
Additionally, near real-time forcing of the LSM by the Multi-Radar Multi-Sensor (MRMS) precipitation and the Global Data Assimilation System (GDAS) sensible weather data provide near real-time, observation-driven products with ~2–8 hours latency. Each of these enable a more accurate depiction of vegetation and soil moisture impacts related to both long-term and short-term drought events, including rapid-onset flash drought events. Research-to-Operations work at SPoRT has led to the development of value-added products such as the derived percentile products for soil moisture. For example, low percentile values from SPoRT-LIS have been shown to correspond well to areas experiencing short-term drought within the U.S. Drought Monitor (USDM). Via Operations-to-Research (O2R) activities with end-users, soil moisture changes on various timescales pertinent to drought applications have been added to the SPoRT-LIS output data suite.
This training will improve the user’s understanding of how soil moisture is modeled within LIS in order to improve the interpretation and application of this output for drought monitoring. Conducted by experts in LIS and operational drought monitoring, the overall course will enable users to interpret SPoRT-LIS soil moisture percentile products for drought applications. Examples from operational applications as well as practice exercises (for using LIS data for drought monitoring) will be included in this course. Access to the SPoRT-LIS products via online viewer, in GIS formats, and GIS-based display tools, will also be included. Moreover, self-paced microlessons will be available to help users confirm their understanding and improve their skill via homework lessons between live sessions.
- Download and install QGIS and all accompanying software
- Register for a Google Colab via Gmail or Gmail enabled account
- Basic Python experience beneficial but not required
A user will be able to apply LIS output to efficiently analyze drought over large spatial areas in conjunction with current practices and to integrate this capability with existing data.
- Identify the NASA/LIS basics regarding the framework, input forcing, static fields, LSM structure, and output most relevant to drought
- Summarize the derived soil moisture percentile products and how these are created
- Apply SPoRT-LIS output and/or derived products to both complement existing data and overcome limitations to monitoring drought over large areas
- Recognize ‘best practices’ for LIS impact related to drought
- Configure LIS output file for viewing within a GIS-based display tool and for tailored output products and graphics
This training series is intended for local, state, regional, federal, and international governmental and non-governmental organizations interested in using NASA data for drought monitoring and forecasting. Appropriate for operational end-users, decision-makers, and researchers with interests/needs in assessing drought, water resources, agriculture, and wildland fire management.
Three, 90 minute sessions.
- Introduction and Drought Background - Christopher Hain
- NASA LIS Framework and Output by Sujay Kumar (30 minutes)
- Why LIS was created; Who’s using it now; What’s the future
- LIS framework, inputs/forcing, static fields, relevant aspects impacting drought like soil type or veg type classifications, data/satellite assimilation capabilities;
- LIS output: soil moisture, layers and other drought-relevant aspects
- SPoRT LIS-CONUS version, Derived Percentiles, Forecasts by Jonathan Case (30 minutes):
- SPoRT LIS-CONUS version/instance; other subdomains
- Unique aspects …. Why is the Green Vegetation Fraction (GVF) used?, MRMS/GDAS usage, NLDAS usage, and 4-5 day rerun to present
- Creation of Percentiles for Relative Soil Moisture (RSM)
- SPoRT-LIS CONUS Forecasts
- Q & A Session (30 minutes)
Materials:
Following each weekly Part there will be a self-paced microlesson, which will not be graded, but serve as a knowledge check and prepare you for the following parts of the webinar series, as well as the final homework assignment. There will be one homework assignment which will be posted on May 31.
- Microlesson to be completed prior to Session 2
- Self-Paced Item 1a: Details of RSM and Other Output for Drought
- Reminder from Live Session plus some details and examples
- Self-Paced Item 1b: SPoRT-LIS Derived Percentiles Important for Drought
- Demonstration of Percentiles, Differences, and Layer RSM – what do these really mean for my own applications?
- Self-Paced Item 1a: Details of RSM and Other Output for Drought
- SPoRT-LIS Early Use and Value in Local Operations; Application of Percentile and Differences by Kris White (25-30 minutes)
- Early use of LIS for drought and eventual use for USDM
- How to consider LIS layers and vegetation types
- What is the context in terms of known climatology? - Percentiles, differences (weekly, etc.), and their application
- US Drought Monitor Application of SPoRT-LIS with Existing Data and Methods by Richard Heim (15-20 minutes)
- Convergence of Evidence: How/why does SPoRT LIS provide value compared to an existing dataset or as a complement?
- From a national view, how does SPoRT-LIS output best provide value?
- Short-term vs. long-term drought analysis with SPoRT LIS;
- State/Regional Climate Application of SPoRT-LIS for Drought Trend Assessments by Barrett Smith and Corey Davis (15-20 minutes)
- Applications for decision making (flash drought, emerging from drought, state-level decisions/actions, conflicting drought indicators)
- Workflow Integration
- Examples of assessing emergence from drought and impacts from extreme events
- Q&A Session (20-30 minutes)
Materials:
Following each weekly Part there will be a self-paced microlesson, which will not be graded, but serve as a knowledge check and prepare you for the following parts of the webinar series, as well as the final homework assignment. There will be one homework assignment which will be posted on May 31.
Microlesson to be completed prior to Session 3
-
- Self-Paced Item 2a: Drought Analysis Application in CONUS and International Domain Example
- Example exercise to test understanding of SME application concepts
- International Domain Example: Apply lessons from live session in unknown area
- Self-Paced Item 2b: Best Practices with SPoRT-LIS
- Discovery of appropriate uses to applying LIS output for Drought via interactive examples and decision making
- Self-Paced Item 2a: Drought Analysis Application in CONUS and International Domain Example
- Display of SPoRT-LIS CONUS Output via SPoRT Web Viewer by Jonathan Case
- Easy and quick viewing of many parameters in set domains
- Custom animations over time, which can be saved for local use
- Acquire and Display SPoRT-LIS CONUS GEOTIFF via QGIS by Matt Smith
- Where & how to obtain a file
- How to view via GIS and REST Service
- How to customize display
- Display and Differencing of SPoRT-LIS within Google Colab/Jupyter by Ryan Wade and Rob Junod
- Read and display of file for SPoRT-LIS Output
- Custom domains
- Differencing tailored to user needs
- Q&A Session (20-30 minutes)
Materials:
If you would like to replicate the Part 3 demonstration:
Attendees will need access to Google Drive and Google Colab. To access these resources, users must use an email ending in ‘gmail.com’.
Download and install the latest version of QGIS.
We will have the video of this demonstration within the training recording available within 48 hours after the presentation for you to go through at your own pace.
Following each weekly Part there will be a self-paced microlesson, which will not be graded, but serve as a knowledge check and prepare you for the following parts of the webinar series, as well as the final homework assignment. There will be one homework assignment which will be posted on May 31.
- Microlesson for Part 3 (Google CoLab/Jupyter Notebook)
- Self-Paced Item 3a: Starter Guide for ingest/display (w/ code examples/snippets)
- Create Your Own Display and Difference Plots of Percentile or RSM (CONUS, International)
- Self-Paced Item 3a: Starter Guide for ingest/display (w/ code examples/snippets)


