SUMMARY
Date: Dec. 10, 2021
Type: Severe & Winter Weather
Region: North America, Midwest U.S.
Info & Resources:
- View data products on the NASA Disasters Mapping Portal
- NASA Disasters program resources for severe & winter weather
- Learn about FEMA's response efforts
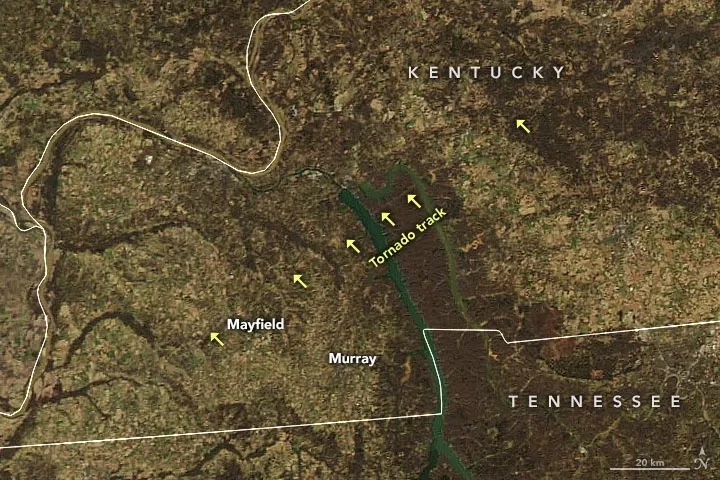
- NASA Earth Observatory: Satellites Spot Tornado Tracks Across Midwest
Update Dec. 16, 2021
Satellites Map Tornado Damage in Kentucky
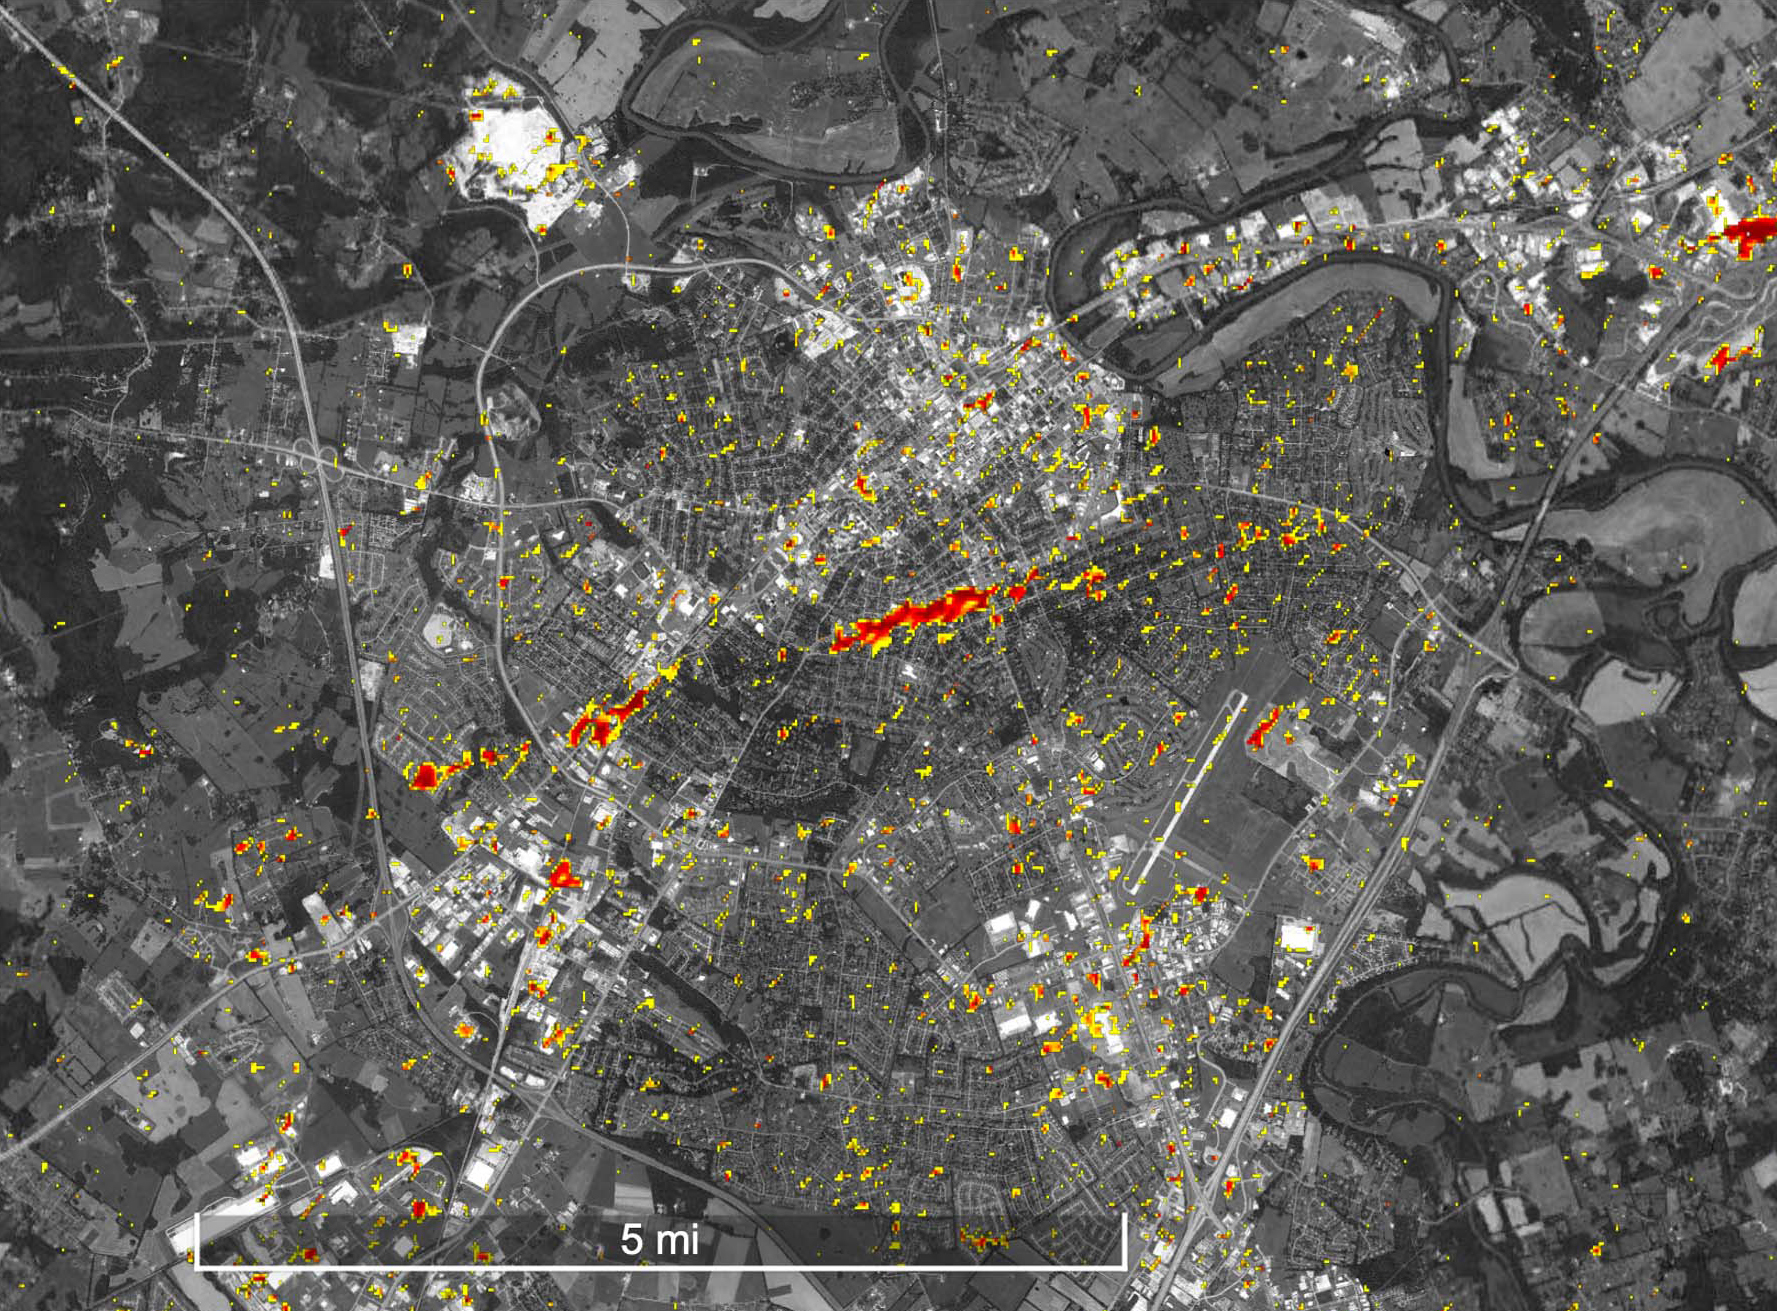
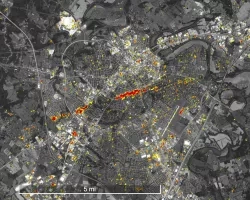
NASA researchers used satellite observations to create a damage proxy map (DPM) to help identify damaged buildings and infrastructure from the severe weather and tornadoes that hit Kentucky and surrounding states on Dec. 10, 2021. Click here to read the full story.
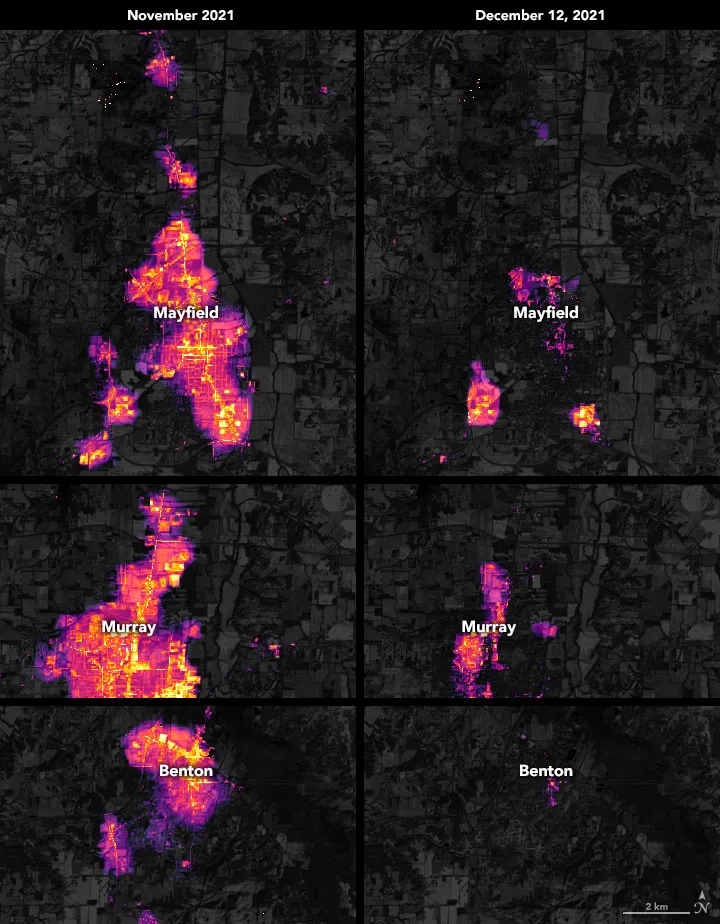
Nighttime Images Detail Kentucky Blackout
A team of scientists from the Universities Space Research Association (USRA) and NASA’s Goddard Space Flight Center (GSFC) processed and analyzed data from the Visible Infrared Imaging Radiometer Suite (VIIRS) on the NOAA–NASA Suomi NPP satellite to generate maps of nighttime light emissions before and after the severe storms passed through Kentucky. Click here to read the full story at NASA Earth Observatory.
Update Dec. 15, 2021
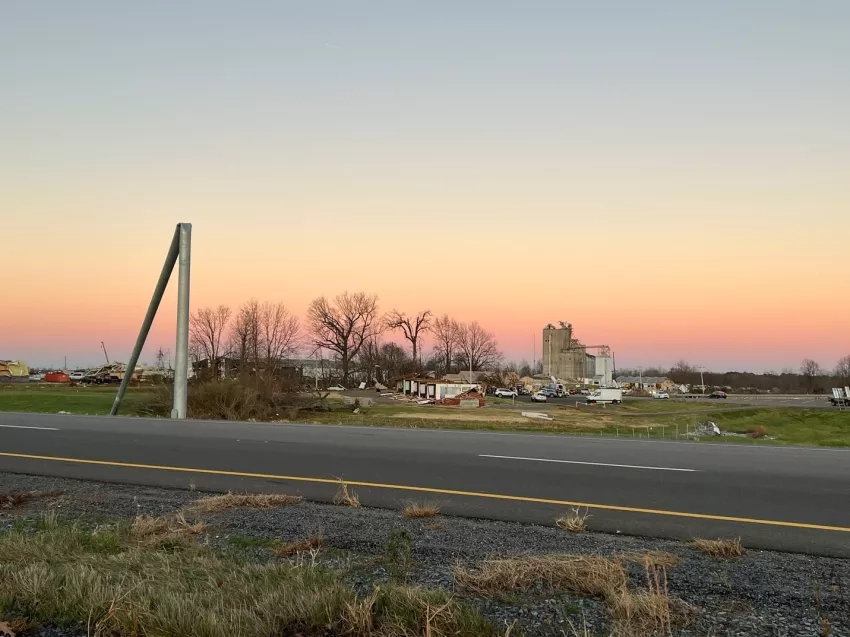
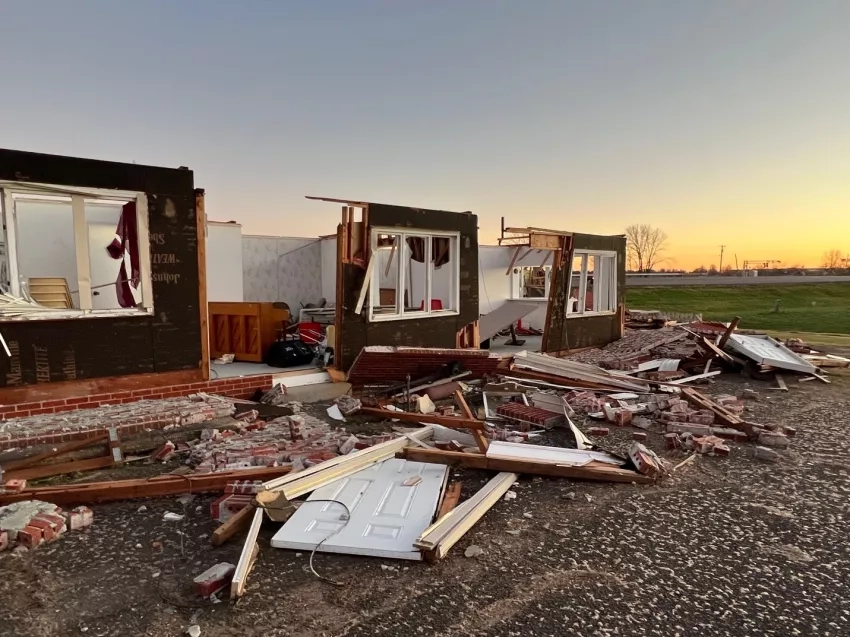
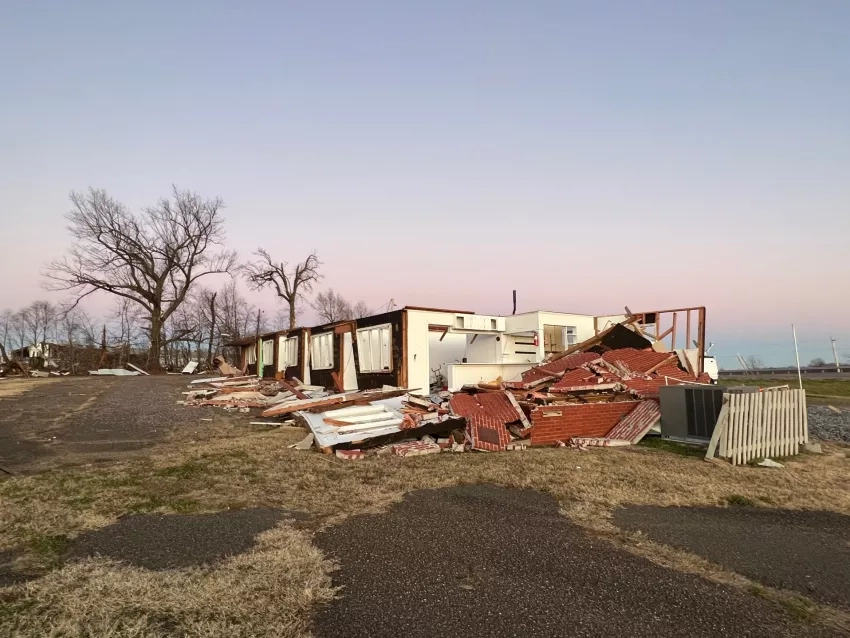
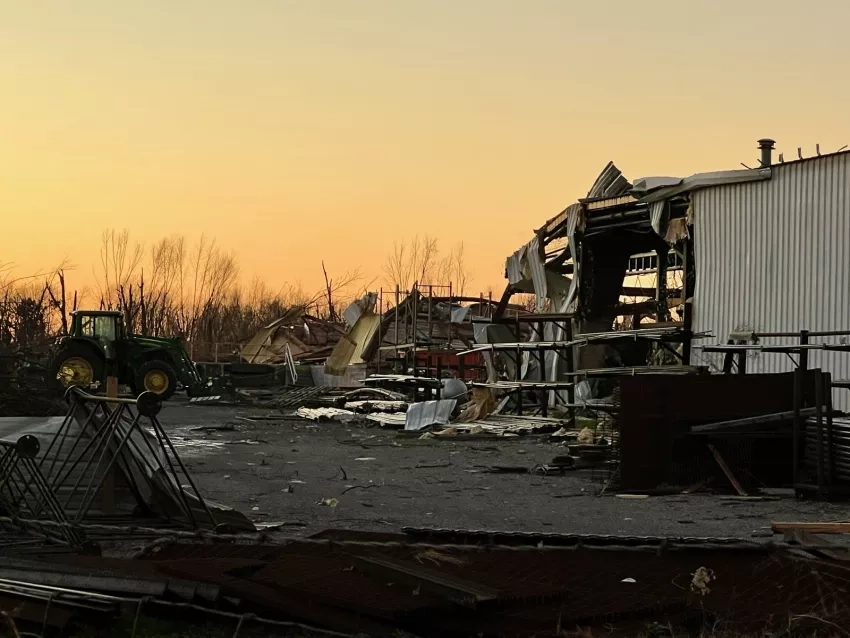
On the night of Friday, Dec. 10, the Midwestern U.S. was struck by a series of tornadoes, intense thunderstorms, and bursts of straight-line wind, leaving a path of destruction across up to eight states, including Arkansas, Missouri, Tennessee, Kentucky, and Illinois. Some of the worst damage came from a tornadic storm with a historically long track that started in Arkansas and crossed through Missouri, Tennessee, and Kentucky for several hours. The storm brought winds ranging from 158 to 206 miles (254 to 332 kilometers) per hour according to the NWS, and a ground track that may have blown across 200 miles (300 kilometers) and spanned 0.75 miles (1.2 kilometers) at its widest. The NWS is still conducting damage assessments to determine the strength of the multiple tornadoes which struck the region, some of which are expected to be EF3 strength or higher on the Enhanced Fujita (EF) scale.
The impacts from the storms have been devastating; with preliminary reports indicating it was the deadliest tornado event in the U.S. since the 2011 Joplin, Missouri tornado. Economically, the outbreak is already considered the costliest tornado event in U.S. history, with initial estimates of $18 billion in total damage and economic loss.
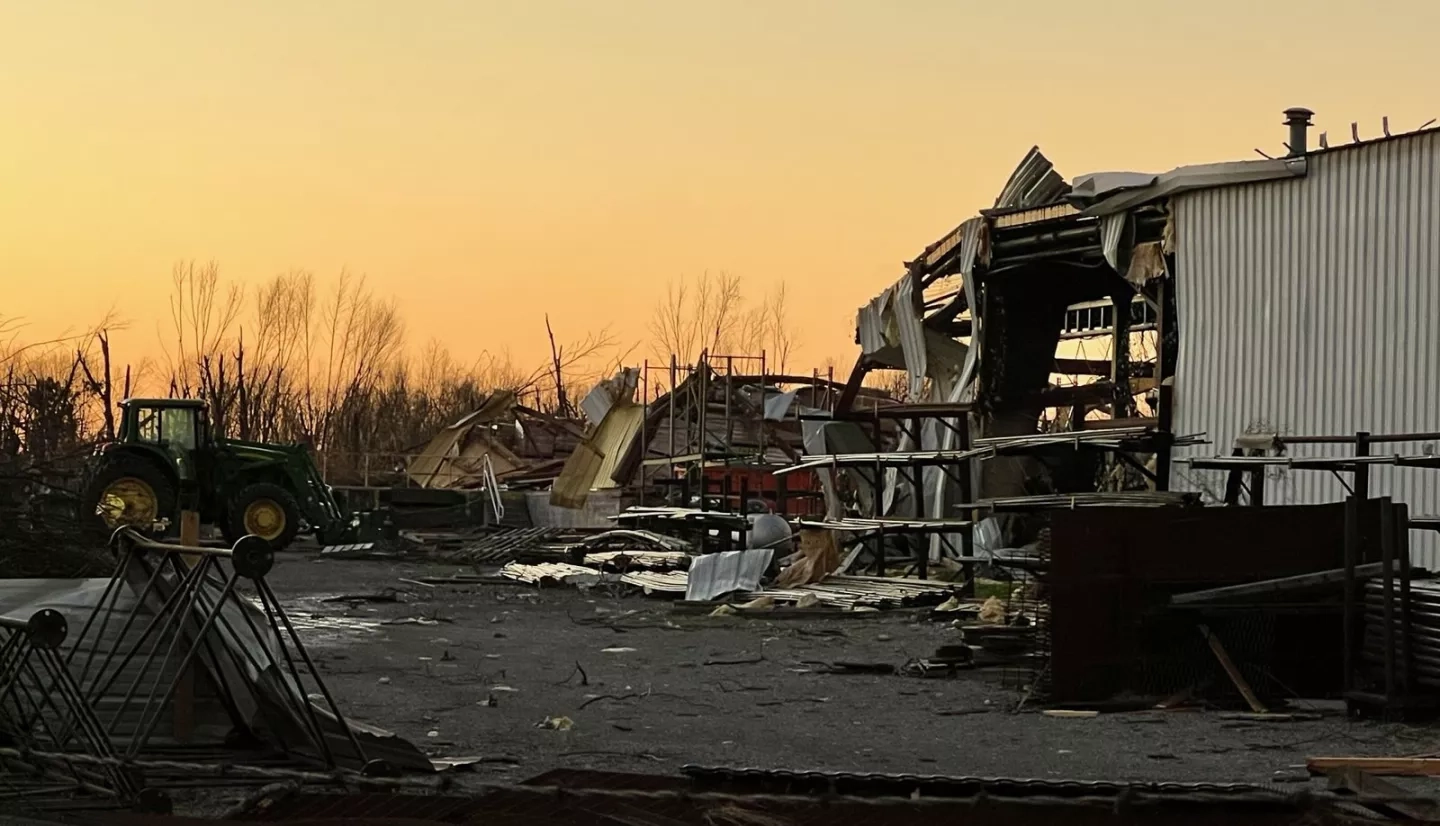
The town of Mayfield, Kentucky was one of the worst hit regions, with over 1,000 homes and businesses destroyed according to media reports. As of Tuesday, Dec. 14 the official death toll from the storms was 88 people, with many more still unaccounted for. Over 25,000 homes remain without power, and thousands of homes have no running water, wastewater treatment or natural gas. Cleanup and recovery from the damage may take years, according to emergency officials in Kentucky.
NASA’s Earth Applied Sciences Disasters program area has activated to support response and recovery for the storms with Earth-observing data and analysis. Researchers are working closely with stakeholders from FEMA and the National Weather Service (NWS), helping integrate satellite observations of the storms into their mapping portals. These include ESA Sentinel-2 and PlanetScope satellite imagery, work that was aided by the IMPACTS team at NASA’s Marshall Space Flight Center who manages NASA’s commercial smallsat data acquisition program. These data can aid disaster response teams in quantifying the location and extent of damage caused by the storms. Day-night-band data from the NASA / NOAA Suomi-NPP satellite are also being used to aid in identifying power outages. Data are also being shared on the NASA Disasters Mapping Portal.
NASA Disasters communications coordinator Timothy “Seph” Allen lives in between two of the worst-hit towns in Kentucky, Mayfield and Benton. “My family is grateful to be safe–and that we were prepared with supplies and a disaster plan,” said Allen “That said, I don’t think there’s anyone in this region who doesn’t know someone who has suffered tremendous loss.” In the days since the storm hit, Allen has been traveling around the region to document the damage and aid recovery efforts. He was able to connect the incident commander in Mayfield with NASA Disasters coordinators to aid in quantifying the damage with satellite observations.
Researchers from NASA's Langley Research Center, supported by the NASA ROSES A.37 research project “Hail Storm Risk Assessment Using Space-Borne Remote Sensing Observations and Reanalysis Data,” are studying the storms using GOES-16 geostationary satellite imagery. While the event was well observed by the U.S. NEXRAD radar network, the team is working to determine how well the storms were detected and characterized in terms of their intensity from a satellite perspective. The analysis of infrared temperature data shows that storm cloud tops reached as high as .62-1.24 miles (1-2 km) into the stratosphere (9.3 miles / 15 km above ground level), and that a distinct line of anomalously cold temperatures aligned with the primary supercell storm track across the quad-state region. Such cold temperatures indicate extremely strong updrafts that support development of powerful tornadoes. This analysis builds upon previous work to find the signatures of tornadoes and extreme thunderstorms using infrared satellite data.
Update By: Jacob Reed, NASA Disasters
