Kilauea has been erupting continuously since 1983, but in late April and early May 2018 the volcanic eruption took a dangerous new turn.
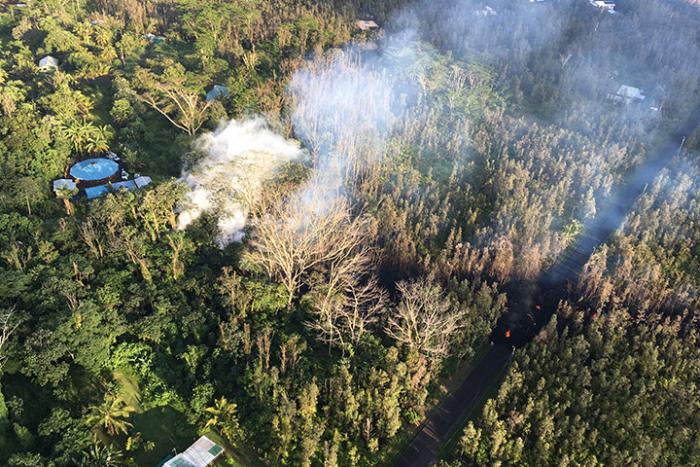
During the last week of April, the lava lake at Halema‘uma‘u Overlook crater overflowed several times and then began to drain rapidly after the crater floor partially collapsed. Soon after, a swarm of earthquakes spread across Kilauea’s East Rift Zone as magma moved underground. On May 3, 2018, several new fissures cracked open the land surface in the Leilani Estates subdivision, leaking gases and spewing fountains of lava. As of May 7, 2018, slow-moving lava flows had consumed 35 homes in that community of 1,500 people.
In addition to seismic activity and deformation of the land surface, another sign of volcanic activity is increased emission of sulfur dioxide (SO2), a toxic gas that occurs naturally in magma. When magma is deep underground, the gas remains dissolved because of the high pressure. However, pressure diminishes as magma rises toward the surface, and gas comes out of solution, or exsolves, forming bubbles in the liquid magma.
“The process is similar to what happens when a bottle of soda is opened,” explained Ashley Davies, a volcanologist at NASA’s Jet Propulsion Laboratory. “The bubbles of sulfur dioxide and other volatiles, including water and carbon dioxide, begin to rise through the liquid magma and concentrate in the magma closest to the surface, so the first lava to erupt is often the most volatile-rich. There’s usually an increase in sulfur dioxide output right before lava reaches the surface, as the gas escapes from the ascending magma.”
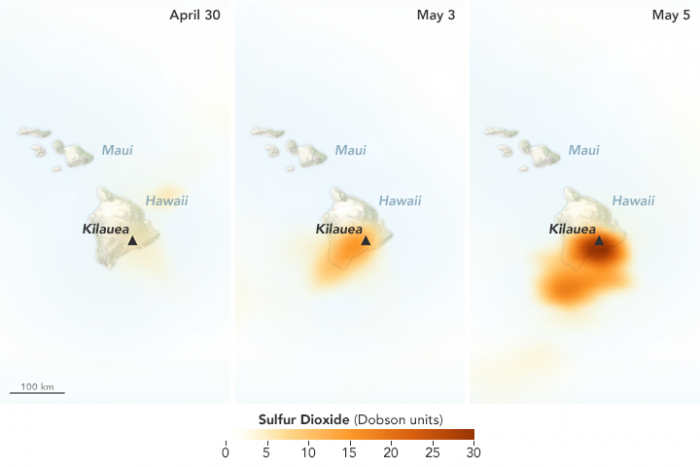
Sensors onboard the Ozone Mapping Profiler Suite (OMPS) sensor on the Suomi NPP satellite have begun to detect signs of activity at Kilauea. The series of images above shows elevated concentrations of sulfur dioxide on May 5, a few days after the new fissures opened up. The second chart (below) underscores the significant natural variability in sulfur dioxide emissions as observed by OMPS over Hawaii between January and May 2018.
“Interpreting the satellite SO2 data for events like this is complicated because there are multiple SO2 sources that combine to form the volcanic sulfur dioxide plume. Kilauea volcano has several sources of sulfur dioxide degassing: the summit caldera (a significant source since 2008); the Pu’u ‘O’o vent on the East Rift Zone; and now the new eruption site in Leilani Estates,” said Simon Carn, a volcanologist at Michigan Tech. “It can be very hard to distinguish individual ‘plumes’ from these sulfur dioxide sources with the spatial resolution that we have from OMPS, but we are seeing what seems to be an overall increase that coincides with the latest activity.”
Another satellite-based sensor—the Advanced Spaceborne Thermal Emission and Reflection Radiometer (ASTER) on NASA’s Terra satellite—observed SO2 emissions on on May 6, 2018. When ASTER passed over Hawaii, the largest source of SO2 appeared to be coming from Kilauea’s summit crater, but there was also a sizable plume streaming southwest from the fissures in Leilani Estates. So far, trade winds have pushed the toxic gas offshore, but Hilo and other communities northwest of Leilani Estates could see air quality deteriorate if the trade winds weaken.
References and Further Reading
- County of Hawaii (2018, May 7) East Rift Zone Eruption in Leilani Estates Update. Accessed May 8, 2018.
- Discover (2018, May 6) Rocky Planet: Lava Flows and Sulfur Dioxide Threaten Leilani Estates on Kilauea. Accessed May 8, 2018.
- Forbes (2018, May 6) NASA Satellites Track Harmful Sulfur Dioxide From The Mt. Kilauea Eruption. Accessed May 8, 2018.
- Global Volcanism Program Kilauea. Accessed May 8, 2018.
- In the Company of Volcanoes (2018, February 21) Communicating volcanoes: resources for media. Accessed May 8, 2018.
- NASA Earth Observatory Volcanic Activity at Kilauea.
- NASA Jet Propulsion Laboratory (2018, May 7) NASA Satellite detects Kilauea Fissures. Accessed May 8, 2018.
- United States Geological Survey Kilauea. Accessed May 8, 2018.
- Weather Underground (2018, May 7) More than Lava: The Dangerous Fumes Belched Out by Volcanoes. Accessed May 8, 2018.


