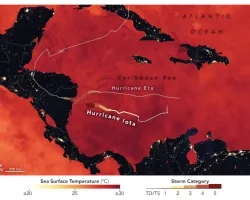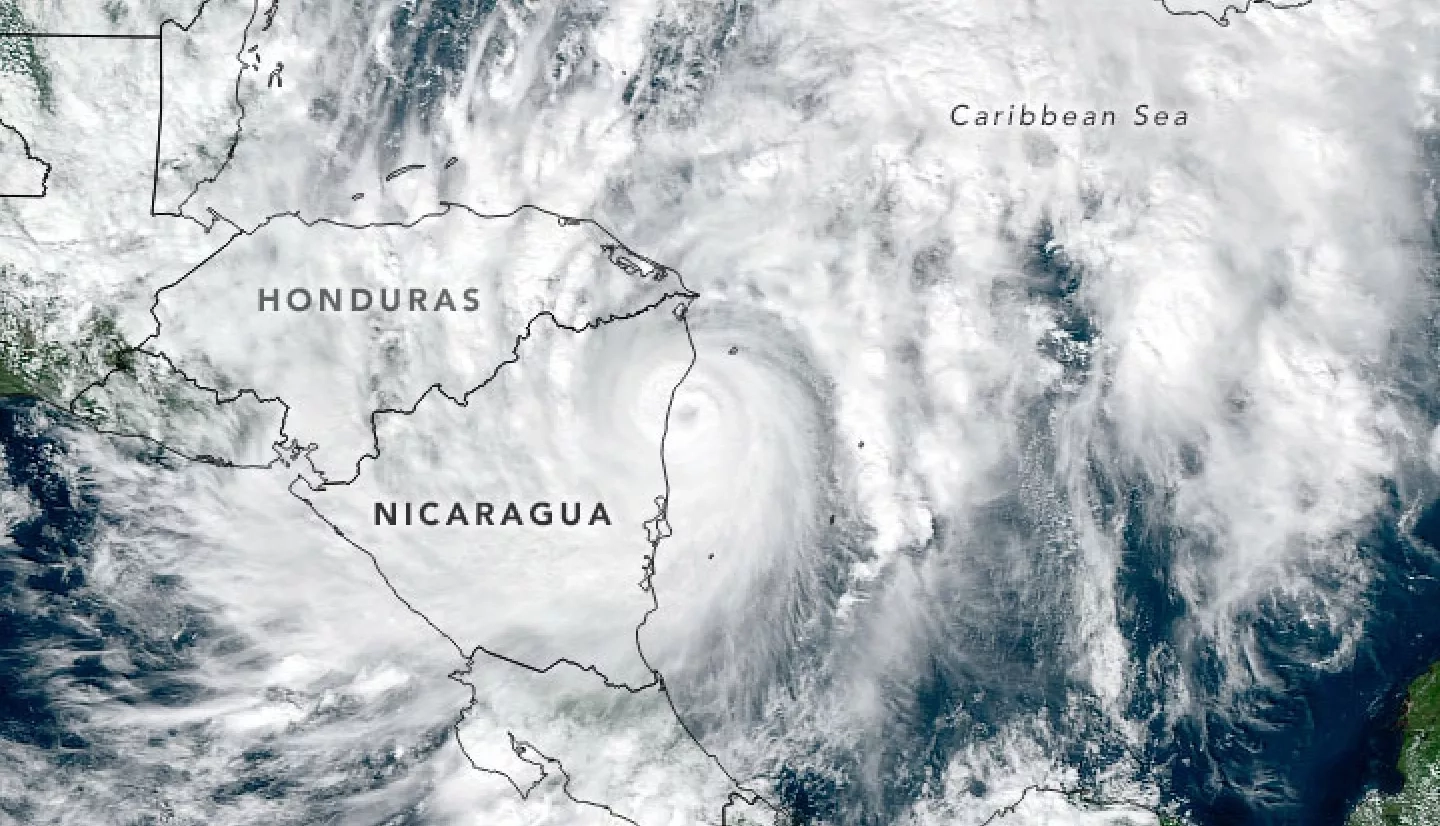
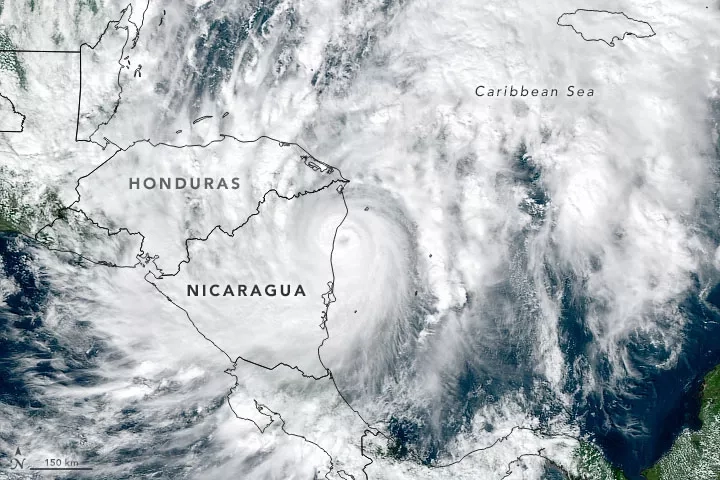
Hurricane Eta, the 28th named storm of the 2020 Atlantic Hurricane Season, made landfall in Nicaragua the afternoon of Tuesday, November 3. The storm brought heavy rainfall to Central America over the course of the week, causing devastating floods, landslides and several casualties according to media reports. Current forecasts from the National Hurricane Center (NHC) indicate Eta will head northeast across the Caribbean Sea, threatening Cuba and Florida early next week.
The NASA Earth Applied Sciences Disasters Program has activated in support of the event, and is working to determine what resources and capabilities may be available to aid response and recovery. The Program is working with the Coordination Center for Disaster Prevention in Central America (CEPREDENAC) to aid stakeholders in the local governments of Costa Rica, El Salvador, Guatemala, Nicaragua and Honduras. Together they are working to address topics such as the extent of flooding in the region, the time of the next useful satellite overpasses, situational awareness for potential landslides, and more. The Program’s work with these agencies is facilitated in part by its leadership role in AmeriGEO, an organization that promotes coloration for risk reduction in the Americas.
The Program is also working with U.S. Southern Command (SOUTHCOM) to provide situational awareness for potential emergency humanitarian assistance and disaster relief planning.
Assessing Landslide and Flood Risk
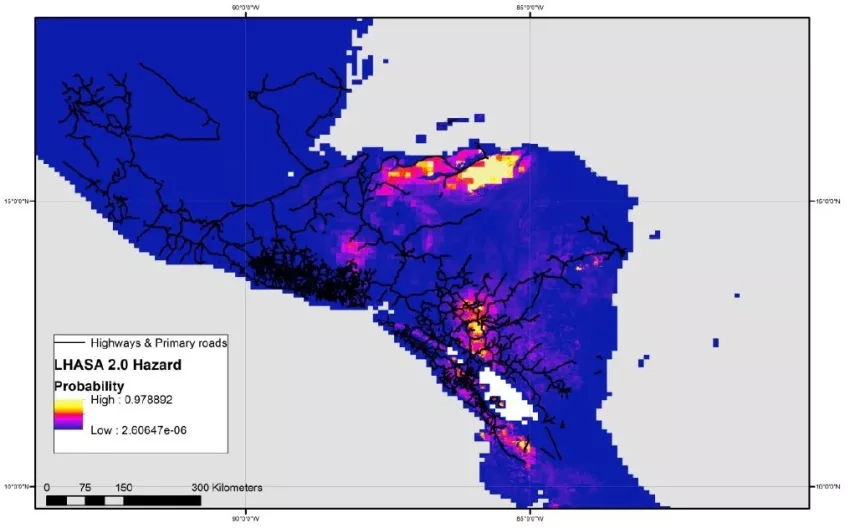
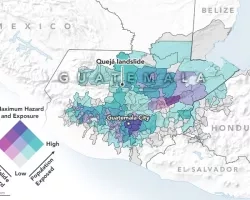
Researchers from the NASA Goddard Space Flight Center Hydrological Sciences Laboratory generated maps of landslide hazard probability for the region using the Landslide Hazard Assessment for Situational Awareness (LHASA) model. The results generated for this event include new experimental results from an updated version of the LHASA model that is currently in development. The model generates a landslide “nowcast” by comparing Global Precipitation Measurement mission (GPM) satellite data from the last seven days to the long-term precipitation record provided by the Integrated Multi-satellitE Retrievals for GPM (IMERG) product. Researchers then combine landslide model outputs with openly available datasets on populations and road locations, which can provide guidance to local disaster management agencies on where to direct their response efforts. This landslide research is funded in part through the Disasters Program A.37 ROSES research project “Enabling Landslide Disaster Risk Reduction and Response throughout the disaster life cycle with a multi-scale toolbox”.
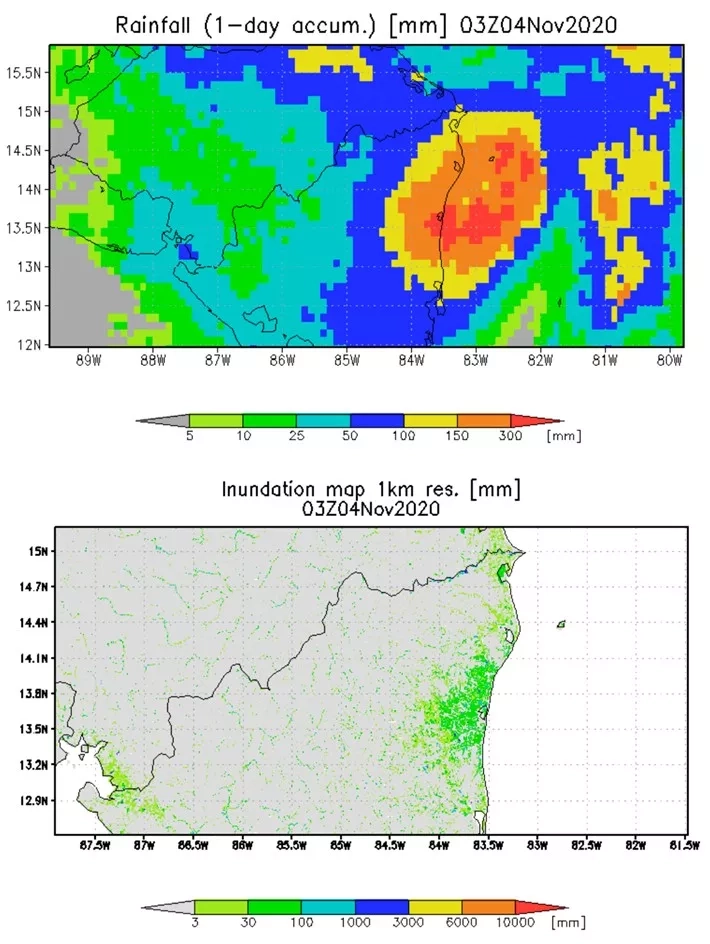
GPM data was also used to estimate impacts from flooding. The Global Flood Monitoring System (GFMS) combines precipitation and topography data with flow routing computations to generate inundation maps, which show the amount that water has risen over typical levels due to flood conditions. This flood research is also funded in part by the NASA Disasters Program.
Please note that LHASA and GFMS are experimental products that may be used as guidance to identify areas of potential flood or landslide risk, but may not indicate the actual presence of floods and landslides.
Related Impact