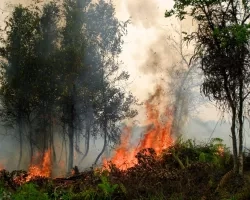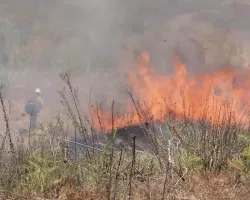
Wildland fires — uncontrolled fires that occur in areas of combustible vegetation — are an essential process that connects terrestrial systems to the atmosphere and climate. But their effects can also be disastrous to the communities in their path, in both the short and long-term.
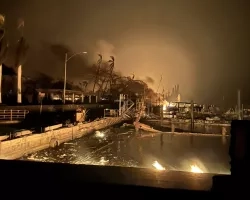
During a fire there's poor air quality, loss of life and loss of property, while after a fire the burned areas are more prone to floods, debris flows, landslides and poor water quality. Climate change has led to longer fire seasons, as vegetation dries out earlier and persistent high temperatures allow fires to burn longer.
The Disasters program area uses Earth-observing data and applied research to support decision-making for local response agencies before, during and after a fire. The team coordinates directly with local response agencies like FEMA and state National Guards, providing actionable data to recover from disaster impacts and build resilient communities.
Earth Observing Data
NASA Disasters Mapping Portal
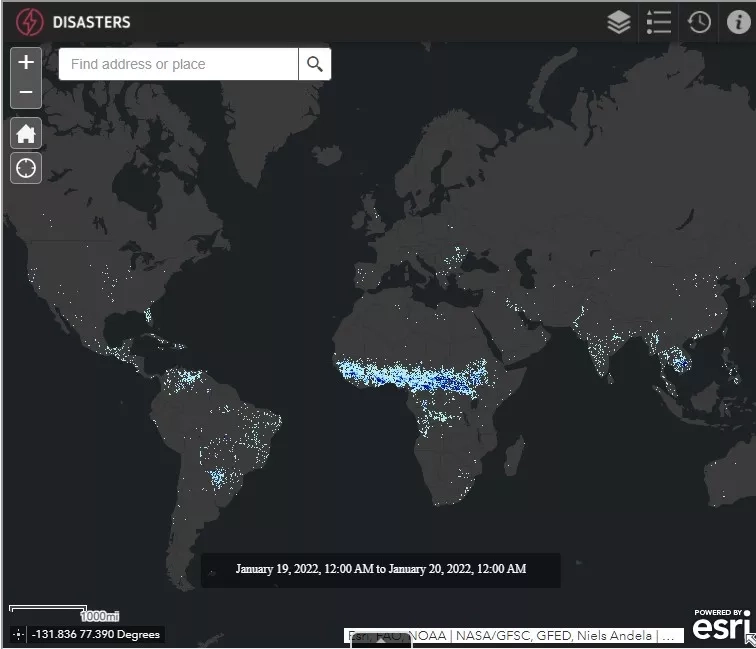
The NASA Disasters Mapping Portal is a powerful online interface for viewing, analyzing, and downloading the latest near real-time and disaster specific products in Geographic Information Systems (GIS) format. The Portal provides a variety of near real-time and event-specific products for monitoring the impacts of fires to support disaster response and recovery.
Routine Products
|
Product Type |
Product Name |
Purpose |
Resolution and Latency |
Links to Data |
|
Active Fire Detection |
FIRMS Active Fire Points |
Determine which regions are currently burning. |
MODIS – 1km |
|
| Burn Extent | Advanced Spaceborne Thermal Emission and Reflection Radiometer (ASTER) |
Identifying burned region | 15m, varies | Examples: California Fires 2020 |
|
Soil Moisture |
Land Information System (LIS) |
Identify dryness conditions that make fires more likely. |
3km, updated daily |
|
|
Damage Detection* |
Damage Proxy Map (DPM) |
Identifies potentially damaged buildings and infrastructure. |
30m, 1-2 days after good overpass |
Examples: |
|
Power Outage |
Black Marble |
Identifies nighttime lights before and after an event, which may indicate loss of power. |
750m – Updated daily |
|
|
Optical Imagery |
Burn Scars and True Color |
Aids in identifying burned areas |
Resolution and latency varies based on sensor. |
MODIS/Aqua Burn Scar |
For a full list of NASA Disasters Mapping Portal Products for Fire Response, please refer to the NASA Disasters Mapping Portal Product Guide
*Products which need to be custom-generated – please contact us for more info.
To learn more about NASA data products available to support fires, visit NASA Earthdata Products for Fires.
Land, Atmosphere Near real-time Capability for EOS (LANCE) Fire information for Resource Management System (FIRMS)
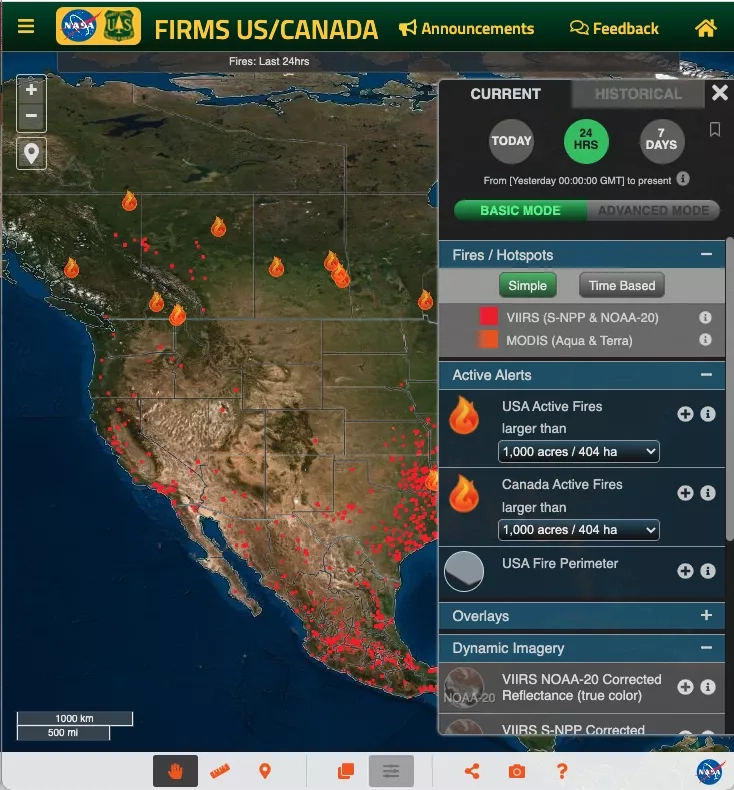
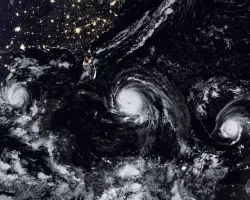
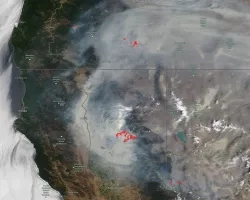
NASA's Land, Atmosphere Near real-time Capability for EOS (LANCE) supports users interested in monitoring a wide variety of natural and man-made phenomena. LANCE’s Fire Information for Resource Management System (FIRMS) distributes near real-time active fire data within 3 hours of satellite observation from both MODIS and VIIRS. The active fire / hotspot data are available to view in FIRMS Global Fire Map, FIRMS US/Canada or in NASA’s Worldview.
NASA Global Fire WEather Database (GFWED)
The Global Fire WEather Database (GFWED) integrates different weather factors influencing the likelihood of a vegetation fire starting and spreading, including NASA MERRA and GEOS model wind-speed data and NASA IMERG precipitation data. It is based on the Fire Weather Index (FWI) System, the most widely used fire weather system in the world.
NASA Airborne Science
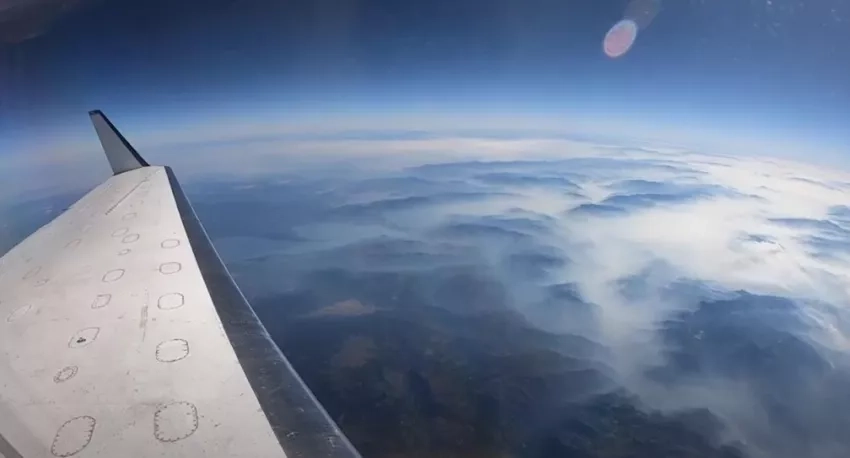
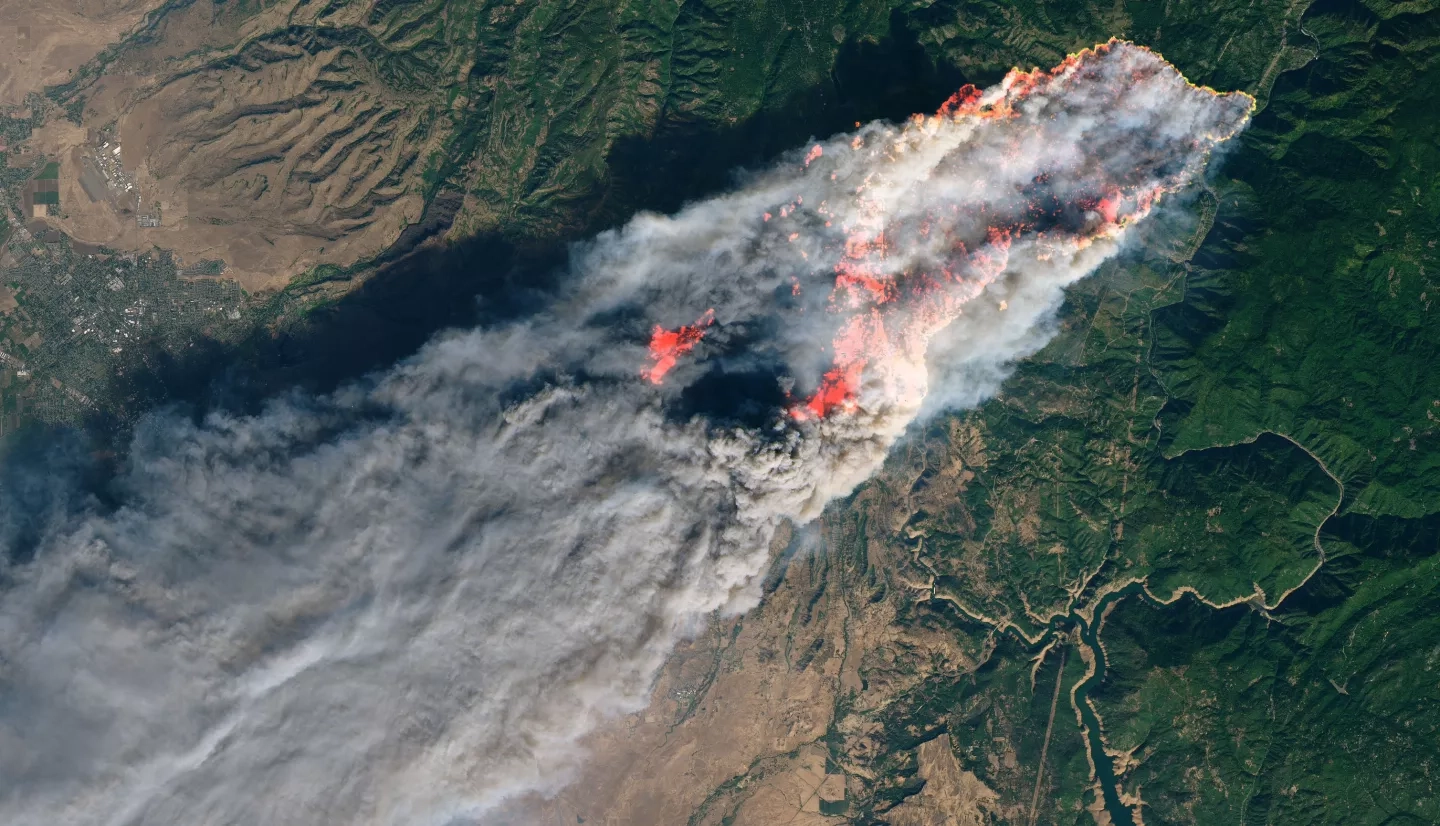
In addition to satellite assets, NASA operates a fleet of aircraft and airborne sensors that contribute to risk reduction, response and recovery from wildland fires. NASA's ER-2 aircraft, operated jointly by NASA JPL and the NASA Ames Airborne Sensor Facility (ASF) flies as high as 70,000 feet to monitor fires with the MASTER and AVIRIS instruments, which can see through smoke and clouds to collect visible, infrared and thermal data on fires and smoke for greater situational awareness of conditions on the ground. The UAVSAR instrument, mounted on NASA research aircraft like the C-20A, can map fine-scale changes to the topography of land. This lets researchers track burn scars, and by combining multiple observations over long periods of time, can be used to track vegetation regrowth from fires. And the DC-8 flying laboratory is used to collect data on air quality impacts from fires during campaigns like FIREX-AQ. Together these airborne assets provide researchers and responders with a clearer picture of how communities are impacted before, during, and after fires.
Other NASA Tools & Resources for Fire Support
Applied Research
Coupled Interactive Forecasting of Weather, Fire Behavior, and Smoke Impact for Improved Wildland Fire Decision Making
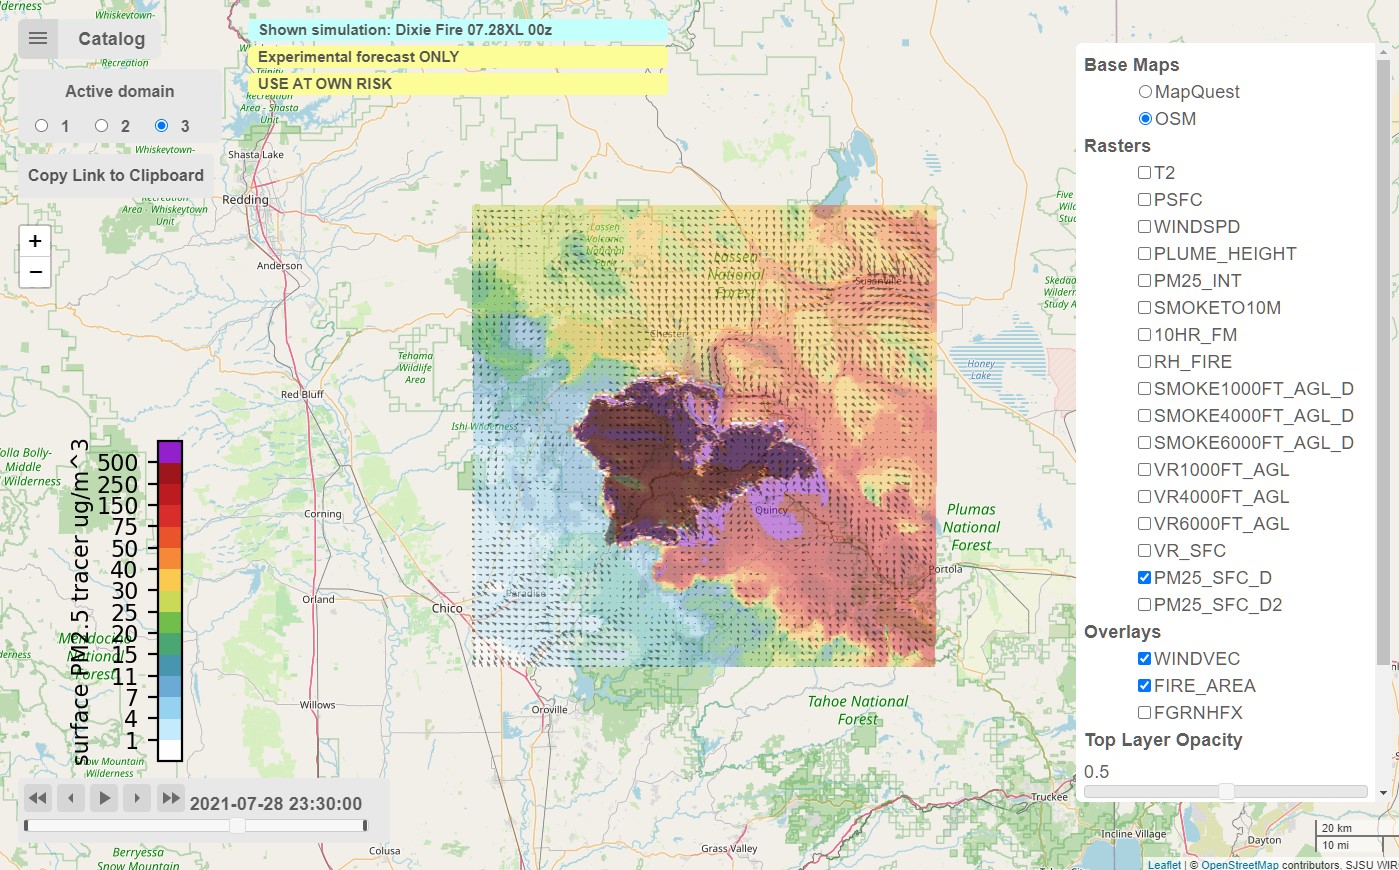
The Weather Research Forecasting – Spread FIRE (WRF-SFIRE) system aims to reduce the risks associated with wildland fires and their management through the integration of weather data, surface fuel moisture observations, satellite fire detections, and operational numerical weather prediction models using very high-resolution (up to 30 m) coupled fire-atmosphere-fuel-smoke modeling. The physical coupling between the atmosphere, vegetation, fire, and smoke makes the forecasting system unique, and is necessary to capture the interactions between these different Earth System components. The WRF-SFIRE system is an open-source modeling system that produces forecasts of fuel moisture, fire spread, and smoke, in addition to traditional weather parameters.
Click here to view the WRF-SFIRE experimental fire forecast products.
Global Rapid Damage Mapping System with Spaceborne SAR Data
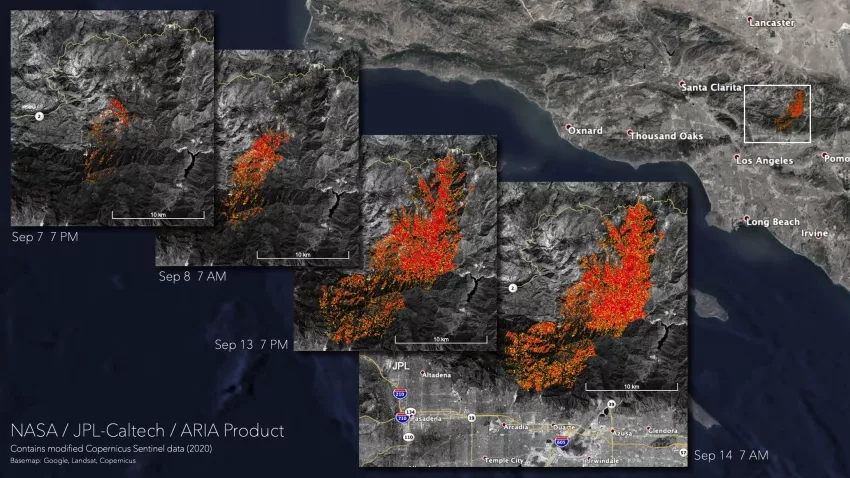
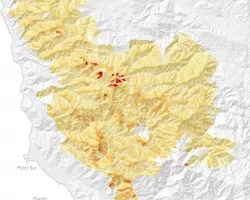
This project works with the NASA JPL ARIA team to develop “Damage Proxy Maps” using Synthetic Aperture Radar (SAR) data, which can help identify damaged buildings and infrastructure from fires and other disasters. The same technique can also be used to identify burned areas to track the fires spread over time. For example, during the 2020 California Bobcat Fire, Disasters provided maps of burned area to CAL FIRE and FEMA.
External Resources
- GEO Global Wildfire Information System
- Conservation International Firecast
- AirNow Fire and Smoke Map
- AirFire Wildland Fire and Air Quality Tools
Related Impacts